


Explore how data-driven sailing gives crews a competitive edge.
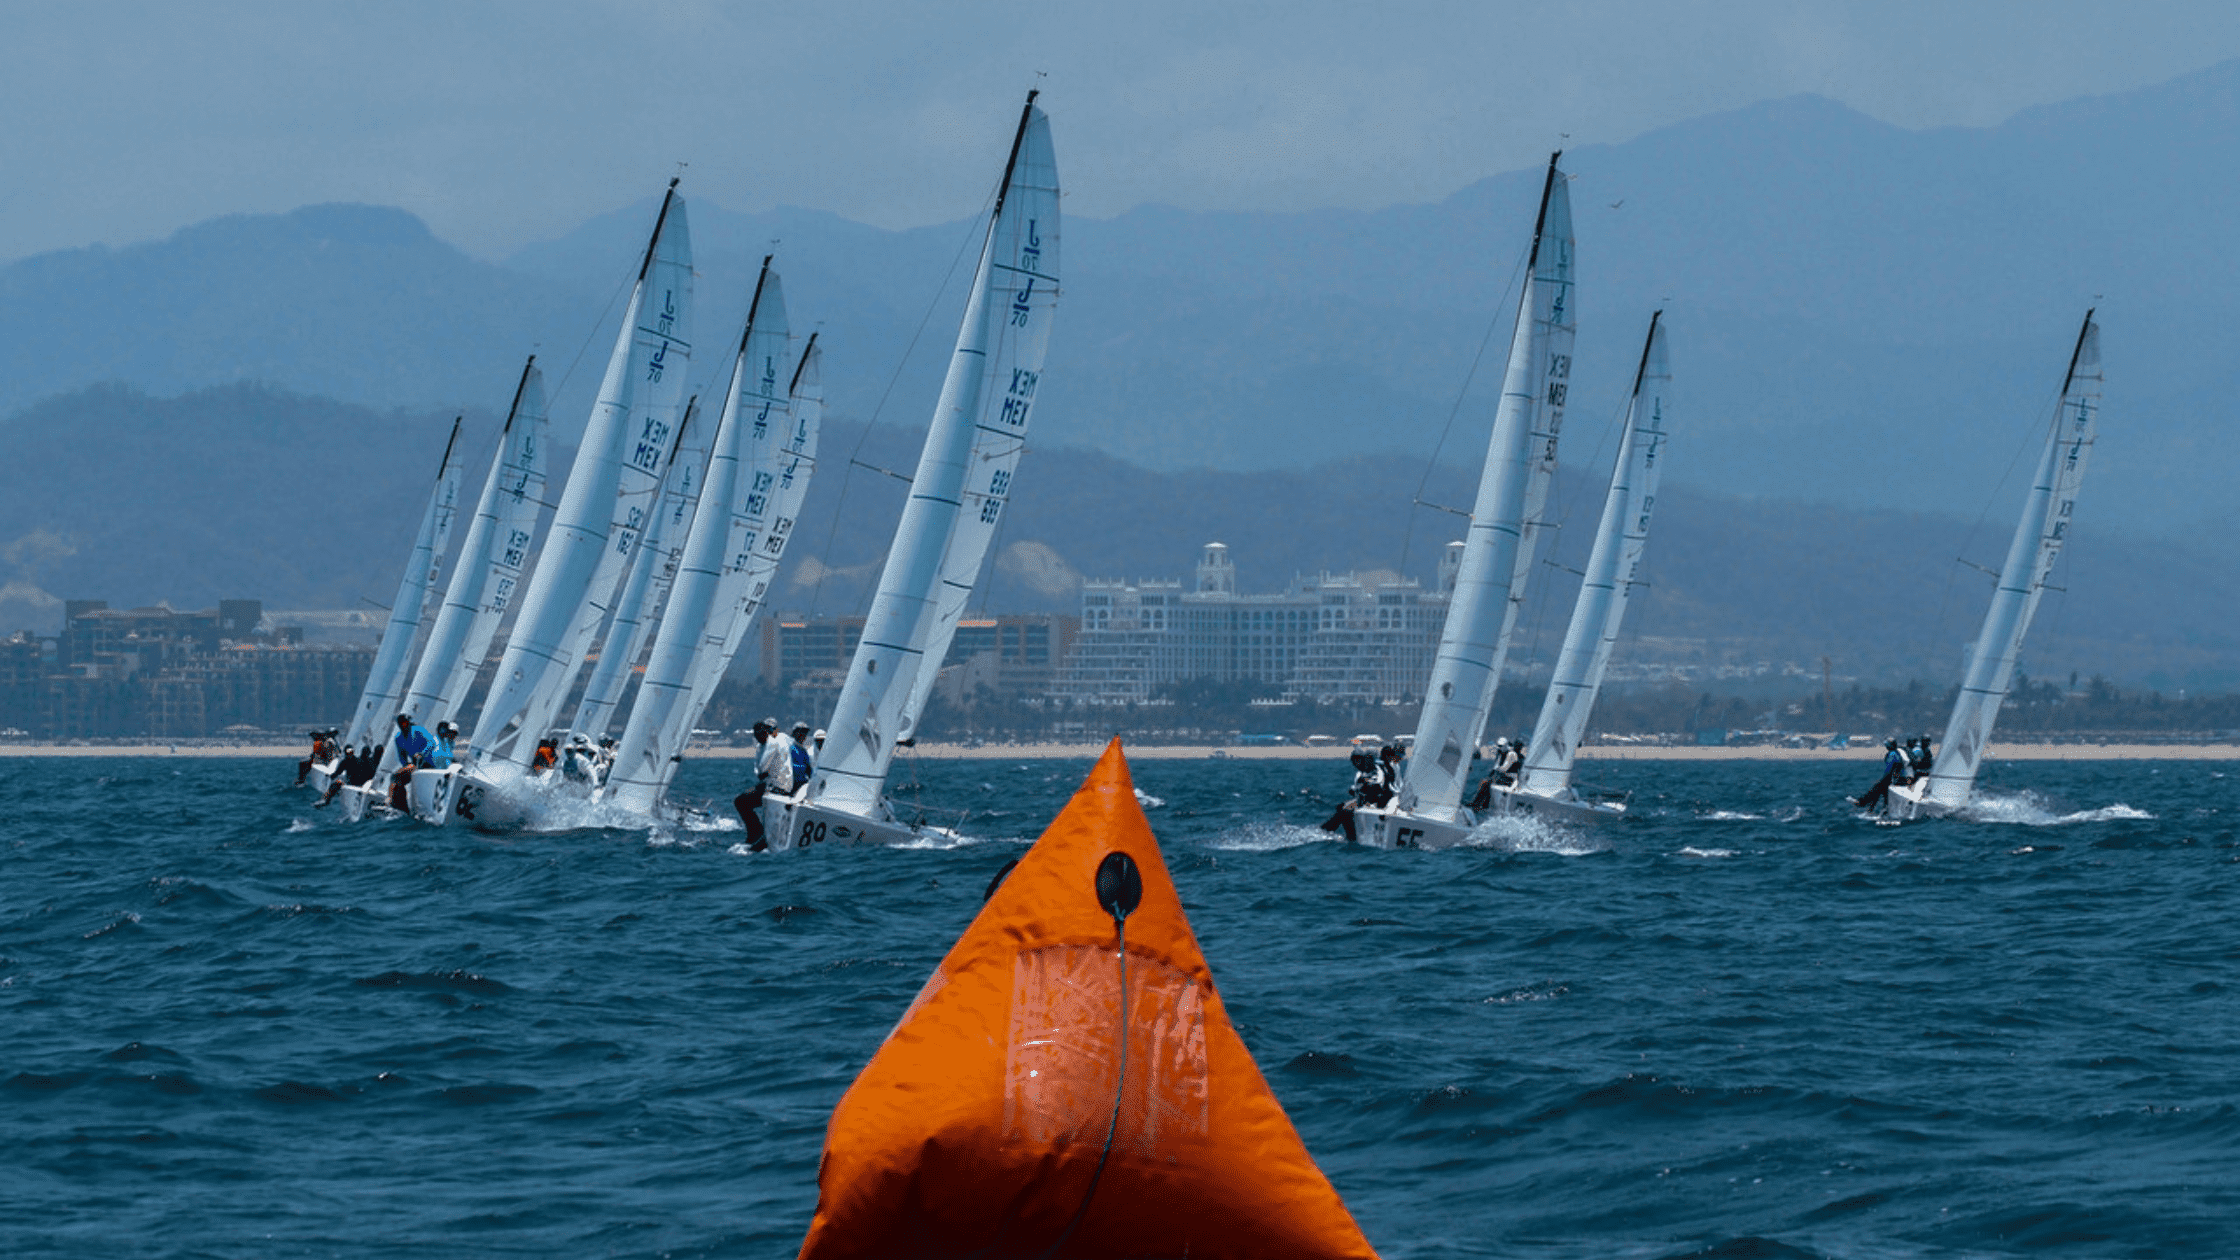
If you picture competitive sailing as a skipper standing at the helm, squinting at the horizon and “feeling the wind,” you’re only seeing half the story. Modern regattas are no longer just about instinct. They’re about engineering, simulation, and data — and lots of it.
At the elite level, sailing has become more like Formula 1 on water. Boats are packed with sensors, crews are trained with analytics dashboards, and design tweaks are tested in high-fidelity simulations long before anyone hits the water. The difference between first place and mid-fleet can be measured in tenths of a knot — the kind of margins only data can uncover.
So, what does “data-driven sailing” actually mean? Let’s dive in.
From instinct to information
For most of sailing’s history, success came down to experience, intuition, and the ability to read the clouds, the water, and the feel of the boat. That’s still true, but the toolkit has changed. Today’s racing crews augment instinct with real-time telemetry and post-race analytics.
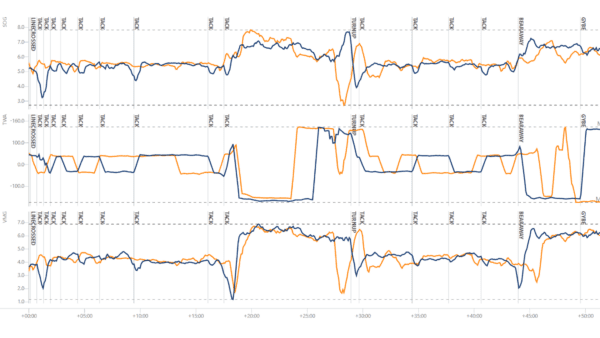
Think about it like this: a sailor can sense a wind shift by feel, but a well-placed masthead anemometer tells you the exact speed and direction, second by second. A trimmer can “feel” when a sail is overloaded, but a strain gauge on the rigging shows the precise forces at work. And once the race is over, you don’t just say, “That tack felt slow.” You open a dashboard and see exactly how many boat lengths you lost, why, and how to fix it.
A typical modern racing yacht carries a surprising amount of instrumentation. Some of the essentials include a high-accuracy GPS to track position and velocity, often down to the centimeter. This system is usually integrated with inertial sensors that measure roll, pitch, and yaw. Which are crucial for any type of boat where stability not always goes hand in hand with performance. On some larger boats, wind sensors can be mounted high on the rig, corrected for boat motion to calculate both apparent and true wind as well as boat speed loggers to compensate against water current and load cells on the rigging, providing feedback on how sails and foils are working under stress.
Lately, there has been an increased desire in having video and data synched together. Crews can review a tack, rewind the footage, and line it up with speed and angle changes to improve the way they perform maneuvers and their sailing in general.
The trick, however, isn’t just collecting data. It’s collecting it in sync. If your sensors are out of step, the numbers don’t add up. But when everything lines up perfectly, you get a detailed replay of the race. You get to see how every tack, gybe, and mark rounding unfolded in terms of both human action and boat performance.
From numbers to decisions
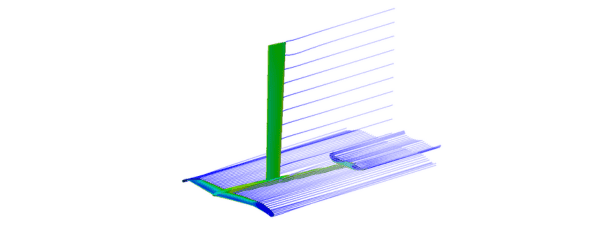
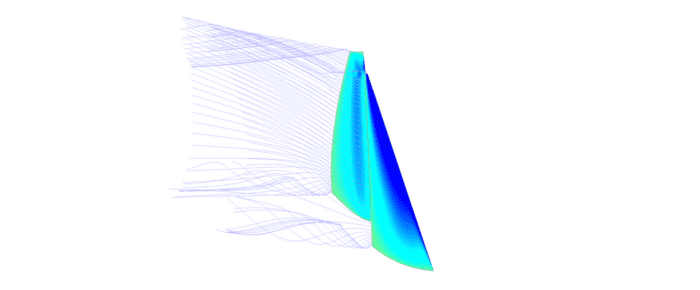
While sensors show you what happened, computer simulations shows you what’s possible. That’s where our engineering expertise comes in.
Using computational fluid dynamics (CFD) among other tools, our designers and engineers can test hull shapes, foils, and sails virtually. We can simulate how a boat will perform across different wind angles and speeds, generating “polar curves” that serve as the crew’s playbook on the water.
For example: If you want to know if a new foil shape will generate more lift with less drag? Run it through CFD and learn the outcome. Likewise, if you are curious if a sail tweak might improve upwind VMG at 12 knots of wind? A simulation will tell you what to expect long before fabric ever touches a mast and perform on-water testing.
This approach shortens development cycles and reduces costly or time consuming trial-and-error test runs on the water. It also has an additional benefit, it gives crews confidence. Crews are not just guessing what the boat should be able to do, they have a data-backed model to compare against and extract the most from their boat while sailing.
This may sound wonderful, however, data alone doesn’t win races. The real advantage comes from turning numbers into smarter decisions, both in the heat of the moment and after the fact during a debriefing session. You can have real-time insights through the onboard displays which can guide split-second calls such as when to tack, whether to cover an opponent, or how hard to push an angle.
Post-race debriefs can feel unnecessary after a good race, but when engineers fuse sensor logs with video and simulation models. It’s like a lie detector in a sense. No matter how good a day was, there’s always room for improvement and we see where a tack was suboptimal, how sails and/or foils were trimmed, or whether the crew hit the optimal wind angle most of the time. Those insights feed into training and tuning tweaks applicable on the next outing.
Sometimes the conclusions are surprising. A maneuver that felt “good” in the moment might show up as slow on the dashboard. Other times, data confirms intuition and gives the crew confidence to double down on a move.
Incorporating data into your workflow
So far we’ve discussed data and it’s benefits. Now we explore the workflow to transform data into actions.
Here’s what a typical analytics workflow looks like:
First and foremost, make sure the boat’s instruments and sensors are callibrated properly and everything including all onboard cameras are synchronized as well .
Then depending on the boat, you may stream or log the data with robust hardware that buffers if connections drop or enough storage space until you come ashore and perform the analysis. Now it’s time for the actual work, it’s time to process all the raw feeds. In some cases you may need to filter noise, combine positioning systems like GPS and inertial measurment units (IMU) for accurate motion logging and compute metrics like velocity made good (VMG) among other relevant perfomance metrics to improve your sailing. Once you are all set, you can compare against polars and other data you may have.
If you are just starting down this path, it is recommended to start creating your polars and benchmarks for future reference. You can then continue by overlaying actual performance against expected values at each wind speed and angle. Once this is done you’ll be able to visualize and review intuitive dashboards, graphs and in some cases heatmaps that highlight the biggest areas for improvement or your focus for a specific metric.
Data Acquisition
Data Processing
Gain Insights
Share and Review
The beauty of this workflow is that once the system is in place, it becomes a feedback loop: each race generates insights that inform training, and each training session validates (or challenges) the models.
So what do teams actually gain from all this? The improvements might sound small: Trimming a tack loss by half a knot, reducing leeway by a single degree, stabilizing foils a little earlier. But in competitive sailing, small margins add up and they add up faster than you think.
One cleaner tack might mean you hit a wind shift first. A half-knot better average VMG upwind can translate to dozens of boat lengths over the course of a race. And in regattas where the top five boats often finish within seconds of each other, those gains are the difference between claiming the top spot and “better luck next time.”
The challenges of getting it right
Like we explained before, sailing data isn’t plug-and-play. Too much data can be overwhelming for crews and coaches. The key is focusing on a handful of KPIs that actually move the needle. In some cases Latency and reliability are constant hurdles and the sensors and equipment have to handle spray, motion, and limited connectivity when operating. Model limitations exist too. Even the best CFD struggles with the the complex world of turbulent, cavitating flows during hydrofoil simulations.
That’s why validation through sea trials remains essential. No matter how high-fidelity the simulation was, there’s always some test condition or scenario that wasn’t simulated to a 100% certainty and therefore needs to be physically validated. Finally, human factors matter. A dashboard is only useful if both the coach and the crew trust and understand it. Presenting the right insight, at the right moment, is as much a design challenge as a technical one.
At Airovex, this is our sweet spot. We specialize in bridging the gap between raw data and competitive performance. Our team designs and build the systems that make data reliable, simulations that make predictions accurate, and analytics pipelines that turn millions of data points into a few clear actions.
Whether it’s designing hydrofoils with CFD, building custom telemetry pipelines, or developing polar curve models tailored to your boat, we make sure data isn’t just collected, we transform it to be used.
Our philosophy is simple: measure what matters, model and simulate what you can, and turn it all into repeatable improvements. That’s what transforms a sailing program from instinct-driven to truly data-driven.
One final note
Competitive sailing will always be about the thrill of the wind and water, but in today’s regattas, numbers tell the real story. The crews who win aren’t just fast sailors, they’re fast learners. They have systems in place to capture, analyze, and act on every gust, every tack, every sail and foil adjustment. As engineering continues to evolve, the boats that combine intuition with information will always have the edge.
At Airovex, we’re proud to help racing teams find that edge. Because in sailing, as in engineering, it’s the details that decide the outcome.